Every form of experiment or research involves collecting some data to derive insights, which requires analysis. Statistics is that aspect of mathematics that deals with collecting, organizing, analyzing, interpreting, and presenting data. Generally, there are two main branches; descriptive statistics, which focuses on summarizing the dataset, and inferential statistics focuses on generalizing results obtained from a sample to the entire population. This blog article will focus on descriptive statistics, and at the end of this article, you will have basic knowledge of the most common terms used in descriptive statistics.
The derived summary is a statistic when the measurement is obtained from a sample (a population subset). However, the summary measurement is called a parameter when the entire population is considered.
Descriptive statistics are generally used to describe a sample. It provides information on the center value (a measure of central tendency) and the spread of observations from the center value.
Measures of Central Tendency
Looking at the Table below, each column in this dataset can be summarized to a single value called the central tendency. A measure of central tendency is a single value that attempts to describe a set of data by identifying the central position within that set of data. In research, the most frequently used measures of central tendency include the mean, median, and mode.
| Unique Key | Date of interview | Participant ID | Age | Sex |
| 1 | 2020-02-13 | 907 | 30 | Male |
| 2 | 2020-02-13 | 8 | 27 | Female |
| 3 | 2020-02-13 | 12 | 25 | Female |
| 4 | 2020-02-13 | 13 | 20 | Male |
| 5 | 2020-02-13 | 15 | 22 | Female |
| 6 | 2020-02-13 | 20 | 20 | Male |
| 7 | 2020-02-13 | 26 | 23 | Male |
| 8 | 2020-02-13 | 29 | 9 | Female |
| 9 | 2020-02-13 | 31 | 30 | Male |
| 10 | 2020-02-13 | 33 | 20 | Female |
The Mean
The mean is the average of all values in a column; it is the sum of all valid observations divided by the total number of observations. Suppose the two datasets on the heights of medical students below:
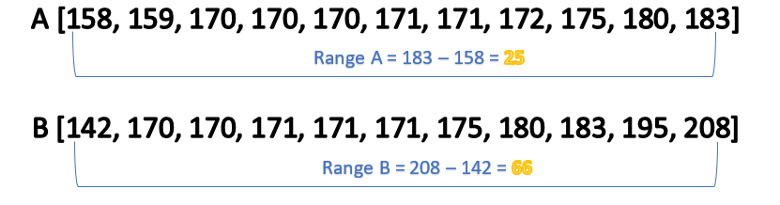
B (175,142,180,171,183,195,170,170,208,171, 171)
A (175,170,180,172,183,159,170,170,158, 171, 171)
——————-
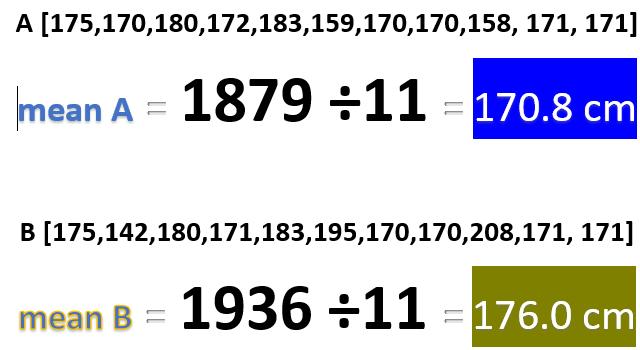
The mean of A and B are 170.8 and 176.0, respectively. The mean is a good measure of the central tendency for continuous data. However, it is sensitive to outliers, as shown by the difference in means A and means B above due to the extreme values in sample B
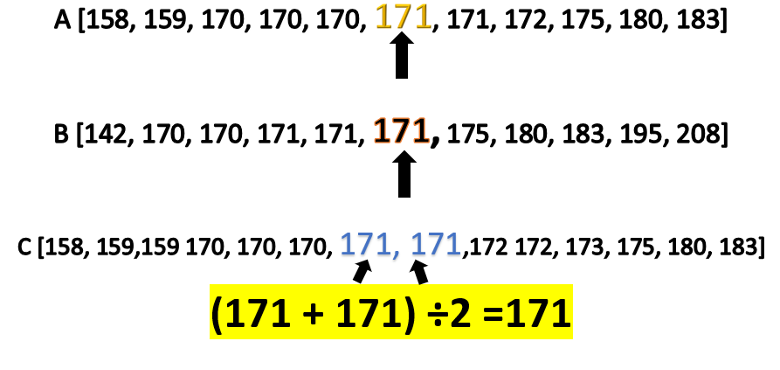
The Median
The median is the middle value above and below which 50 percent of the total observations are located. It involves arranging the observations by increasing order and selecting the (n + 1)/2 -th observation for odd number of total observations or the average of the n/2th observation and the (n/2 + 1) -th observation for even number of total observations
The median is considered a robust measure of central tendency because it is not affected by outliers or extreme values
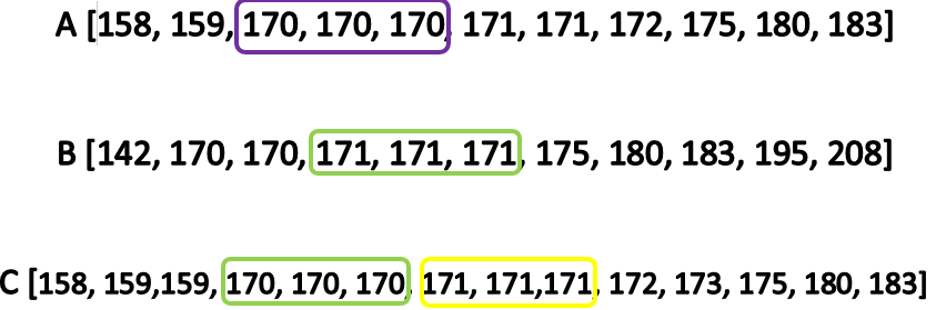
The Mode
The mode is the most frequent observation in a dataset, A dataset where all observations are unique has no mode, whereas when there is a tie in the frequency of specific observations in a data set, it is said to be multimodal.
Measures of spread
Providing a single value doesn’t tell the whole story. Information about the relationship between observations or how distant observations are from the central value is essential in descriptive statistics.
Range
This represents the difference between the maximum and minimum values. Obviously, it is affected by extreme values (Range A = 25, B = 66). It, however, gives a sense of the spread of different data points.
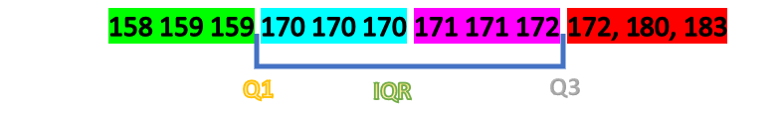
Interquartile range (IQR)
It is the difference between the 3rd and 1st quartile (75th and 25th percentile). It is considered a robust major of spread as it Is not affected by extreme values. The IQR is always presented in conjunction with the median. Presenting the 25th and 75th percentile is more informative.
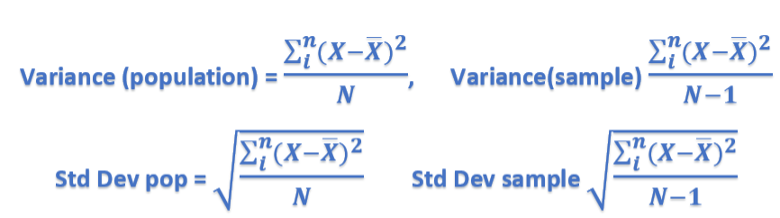
Variance
The variance measures the average of the squared sum of differences from the mean. The more spread the data, the larger the variance is in relation to the mean. It is less often presented as a stand-alone statistic in research.
Standard deviation (SD)
Simply, it is the square root of the variance. It is always presented alongside the mean. A large SD signifies a high level of dispersion between the data points in any given dataset.
It is essential to highlight that the formula for the calculation of variance and the standard deviation is different for a population and a sample
Considering our samples, A and B above, the Variance of A and B are 55.76 and 275.40.
The standard deviations for sets A and B are 7.45 and 16.59, respectively. A large SD represents more significant variability between data points, whereas a narrow SD represents data points clustered around the mean.
Distribution
This aspect of descriptive statistics involves a visual representation that provides information about the spread and relationship between different observations in the dataset. Data points can be summarized using frequency tables and charts.
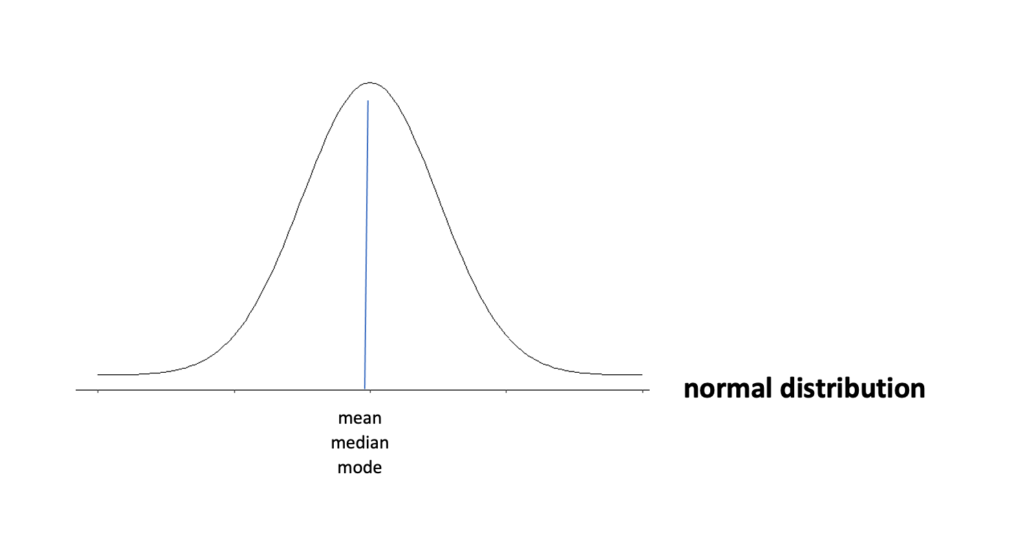
Normal Distribution
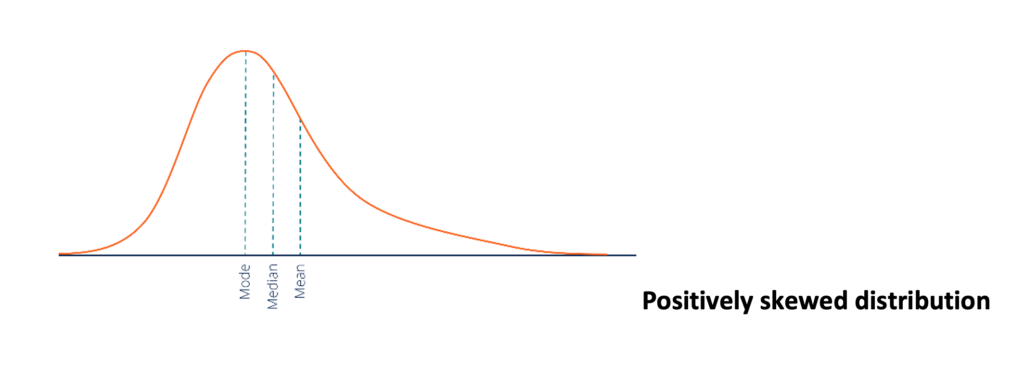
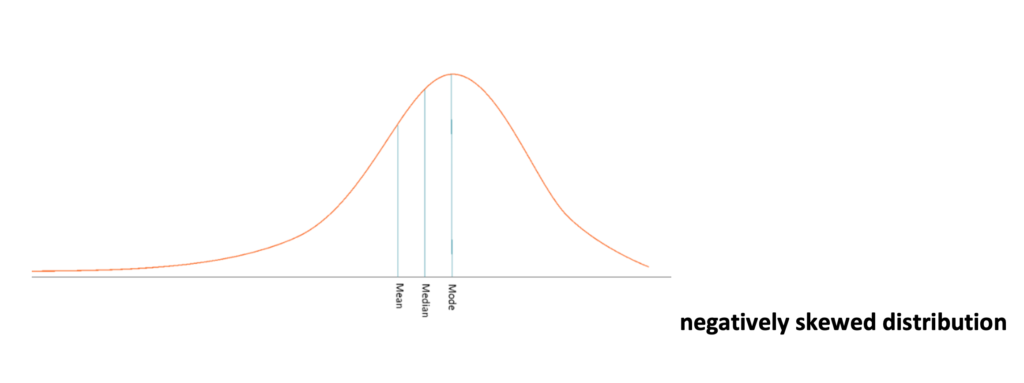
Continuous variables are often presented as frequency tables and histograms. A normal or gaussian distribution is described when the mean, median, and mode are similar. It is a theoretical distribution, and real-life approximates the normal distribution since one rarely gets a distribution of scores from a sample that exactly fits a Gaussian distribution. A distribution is skewed when a series of values cluster at one end with few sores pulling the scores to the other end. A positively skewed distribution results when the few scores pulling the tail of the distribution are on the higher end of the distribution; when scores cluster at the higher end with a few scores are pulling the tail to the lower end, it is termed negatively skewed.
NB: Descriptive statistics gives a glimpse of which statistical tests will be employed for inferential statistics
In summary, descriptive statistics provide information on:
- Central value
- Variability
- And distribution of data points which can be presented as frequency tables and charts
References:
- Descriptive vs Inferential Statistics Explained. (n.d.) https://careerfoundry.com/en/blog/data-analytics/inferential-vs-descriptive-statistics/
- Urdan, T. C. (n.d.). Statistics in Plain English: Fourth Edition. www.routledge.com/cw/urdan
- Downey, A. (n.d.). Think stats.
About the authors


This is a great brief example for everyone especially for some who just want to do data collection for the first time. Thank you Doctors