
Introduction
Tables and figures are a great way to communicate your data in an easy and visually appealing way. In this article, you will learn how to present tables and figures that clearly communicate your message, based on recommendations by most Journals and Universities. This article focuses on the practical issues and is suitable both for writing a manuscript for publication and for a thesis/dissertation.
Generally:
Every Table or Figure MUST be a stand-alone as a sequel to the preceding text. The reader must be able to understand it without further reference. It should be clear, labelled, abbreviations defined, and have a caption and legends which describe it clearly with the aim of making it as simple as possible.
Tables and figures are numbered chronologically in the order in which they appear in the text (for example, Figure 1 is referenced in the text before Figure 2 and so forth). The order of numbering for figures is independent of that for tables (e.g. Table 1., Table 2. AND Figure 1., Figure 2.).
Every table and figure included in your work MUST be referred to in a preceding text, preferably using parenthesis. For example: “We found no association between smoking and coronary artery disease (Table 1).”, “As shown in Table 1,…” or “Results are shown in Table 1.”
In the text, the word Figure can be abbreviated as “Fig.”, but “Table” should not be abbreviated.
Place each Table or Figure as close as possible to the sentence where you first referred to it in the text. This can be after the paragraph, on the next page or before the next heading.
Reference the author(s) or authority if the table or figure is from or adapted from someone else’s work. Include the words “Adapted from” or “Adapted with permission from” followed by the author’s name and a citation or link at the end of the caption.
The structure of an effective Table
Typically, a table is made up of a caption or title, column titles and a table body (which contains quantitative or qualitative data), it may also include footnotes (Table 1).
1. Caption (Title):
The Caption, also called Legend should clearly inform the reader of what the Table is all about and how it’s organized. Tables are read from top to bottom, so titles are placed above the body of the table and are left-aligned.
2. Column titles:
Column titles are short, descriptive and include the units of analysis.
3. Table body:
Information on tables is usually presented in columns (from top to bottom). When using numerical data with decimals, try to make the decimal points line up whenever possible.
4. Footnote:
You can use them to further explain the data presented in the table. You can use symbols or abbreviations in the table and provide their full meaning in the footnotes.

The structure of an effective Figure
Figures may be graphs, diagrams, photos, drawings, or maps. Pick the simplest Figure which can convey your message most effectively. They should not repeat the information found in the Tables. Like Tables, Figures should be centred horizontally on the page.
1. Figure captions
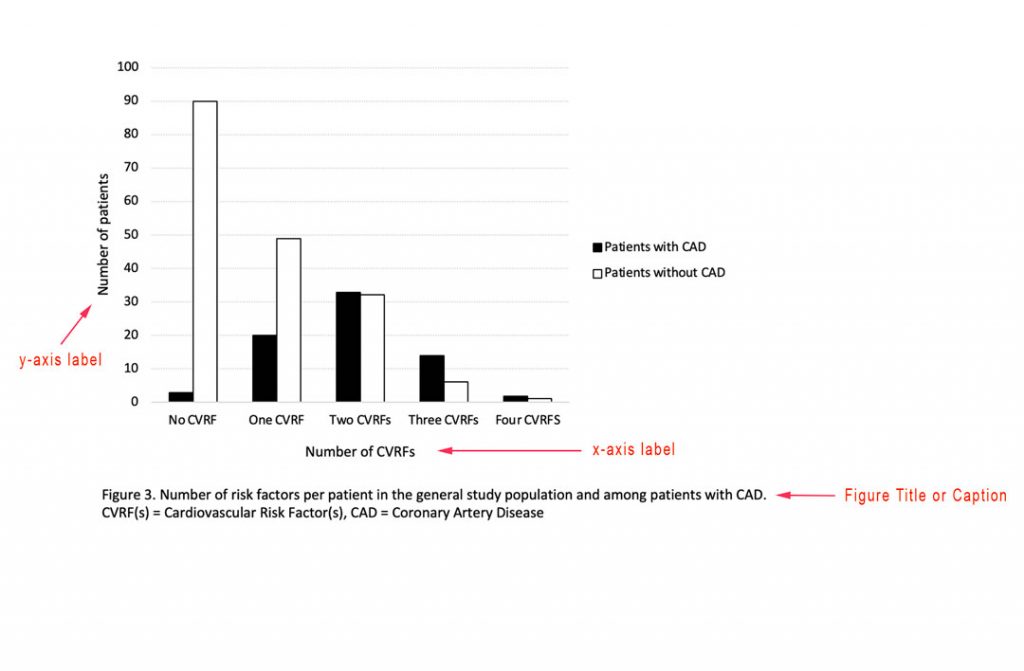
The Figure caption should be descriptive, concise and comprehensive. Unlike Tables, Figures are read from bottom to up, so captions are placed below the figure and are left-justified (Figure 1).
2. The Body of the Figure or Image:
The reader must be able to read details without straining the eyes, so the Figure should be large enough and have a good image resolution. When using graphs, include axes labels, scale and units.
Formatting of Tables and Figures:
- Generally, Table gridlines should be invisible and only horizontal lines separating the caption, column titles and footnotes from each other should be left visible. Some journals may have a custom design for all Tables and Figures. When you submit your manuscript, these journals can modify it to fit their design in the published version.
- When you have multiple Tables and Figures, be consistent with the design.
- Keep Tables simple, preferably in black and white. Avoid using shouting colours, if you must use colours select a gentle colour like blue. Pick complementary colours that visually match. The bottom line, stick to black and white whenever you can.
- Use the same font for the entire table.
- Keep tables and Figures centred-justified.
The video below shows how to format a table in Microsoft Word.
Summary
Tables should be:
- Centred horizontally on the page.
- Numbered chronologically as they appear in the text.
- Referenced in the order they appear in the text.
- Labelled with the table number and descriptive title above the table.
- Labelled with column and/or row labels that describe the data, including units of measurement.
- Set apart from the text itself; the text does not flow around the table.
Figures should be:
- Centred on the page.
- Titled (beneath the figure) with the figure number (“Figure” can be spelt out [“Figure 1.”] or abbreviated [“Fig. 1.”] as long as you are consistent).
- Numbered in the order in which they appear in the text.
- Referenced in the order in which they appear in the text
- Set apart from the text; text should not flow around figures.
ALSO READ: Writing a good results section of a thesis/scientific paper
Bibliography
- Almost Everything You Wanted to Know About Making Tables and Figures
http://abacus.bates.edu/~ganderso/biology/resources/writing/HTWtablefigs.html
- Figures and Charts by The University of North Carolina at Chapel Hill
https://writingcenter.unc.edu/tips-and-tools/figures-and-charts/
- Figures, Tables and References
http://www.bris.ac.uk/Depts/DeafStudiesTeaching/dissert/Figures,%20Tables%20&%20References.htm
About the authors


This is a very nice guide.
Dr Ebasone explains the presentation of data in very simple and clear terms.
Following this can definitely make your data easy to visualise and understand
Thank you Doctor.
Thanks a lot for the great and straight to the point lecture doctor Ebasone!
This will go a long way to contribute in my career development.
Thanks Dr ebadone for the clear orientations
You are welcome. Hope this can help you improve your tables and figures in your dissertation.
Thanks Dr for this explicit guide.
You are welcome Sonia.
Straight to the point and gives you most,if not all of what’s needed at the same time ….huge fan
Well-done doc Ebasone. I think it’s an extremely helpful piece.
Concise, precise, easy to read, just Excellent!!!
Thanks Doctor. Straight forward.
Great job!
Très instructif Dr , Merci
Merci docteur
Just on point. Thank you Dr.
Kudos Dr. Vanes,
Always get chills when I discover African, especially Cameroonians contributing the the world of research.
Very explicit. Thanks Doctor!